
Track over time identified resources that have drifted or are not managed by Terraform.
Track over time identified resources that have drifted or are not managed by Terraform.
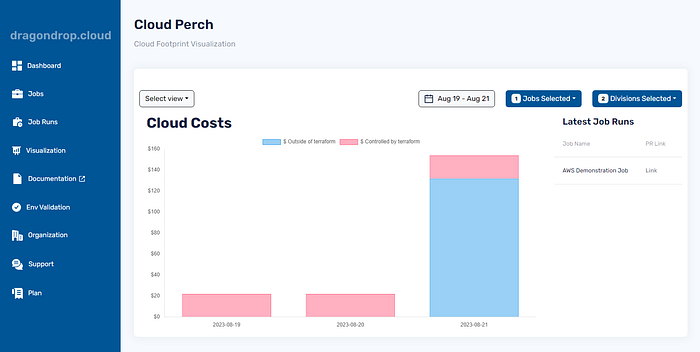
Identify when costs managed and unmanaged by Terraform arise in your environment.

Visually lock-in on potential security threats when they flare up, whether the resources are codified or not.
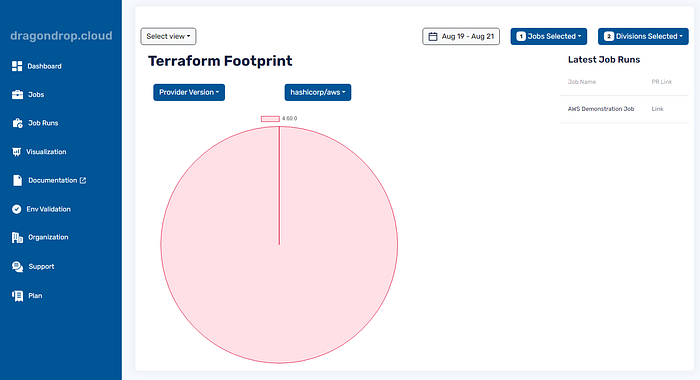
Track Terraform, Terraform provider, and module versions across your cloud environment to ensure compliance with the latest versions.